By Bruce Nevin
Anyone who comes to PCT from a field of science that touches on behavior is challenged to rethink that field in terms of negative feedback control. At the 2002 CSG Conference, I demonstrated how a linguist interacts with a speaker of an unknown language, and it was generally agreed that I was testing for controlled variables. The process that I demonstrated results eventually in a representation and a description from which anyone suitably trained in the field could reproduce the utterances so represented. However, it does not identify what perceptions a native speaker of the language is controlling.
Let me emphasize the point: A phonemic representation and phonetic description makes it possible for a (suitably trained) person to learn to control certain perceptual variables as a native speaker does, without going so far as to actually identify those variables. Such a description captures the controlled variables without identifying them�or, more precisely, without showing whether it has identified them or not.
In the search for controlled variables, some of the observable features of speech that are used in such a description can be eliminated as candidates. Those descriptors that are not directly perceptible, but are available only to an observer using special equipment, cannot be variables perceived and controlled by the speaker and listener. But that does not mean that these descriptors are irrelevant to that search. Nor, of course, does it mean that by process of elimination the residue comprises only controlled variables.
Human speech has been investigated for a long time. In the 19th and 20th centuries especially, researchers developed methods and tools for accurately measuring aspects of speech production and perception. But, in the words of a sign that used to hang in Einstein�s office, �Not everything that counts can be counted, and not everything that can be counted counts.� This prolegomena to PCT linguistics surveys some of what linguists and phoneticians have identified and measured, and considers possible other perceptual variables that are more difficult for an observer to measure. The discussion of speech sounds concludes with a summary of what appear to be the controlled variables in speaking and in speech recognition.
Just what features are best for description of speech, and how they are related and used, is a field that has been worked and reworked for many years, but never quite settled. Linguists and phoneticians describe speech sounds in acoustic terms, and they describe the means for producing speech in terms of the actions of articulatory organs such as the tongue, lips, and larynx. The earliest phonetic descriptions were in articulatory terms.
Lying athwart this dichotomy is the question of whether the difference between two feature values is phonetic or phonemic. Phonetic descriptors are necessarily universal, applicable to all human speech anywhere. The International Phonetic Alphabet, designed in the 1880s and refined in a number of revisions since then, suffices for phonetic description of every human� language. Vocabulary, however, is idiosyncratic for each language. Even words borrowed from one language into another are subjected to reinterpretation, phonetic as well as semantic and syntactic. A fortiori, the phonemic contrasts between utterances, and the detailed means for keeping similar words distinct from one another, must be established for each language.
Nevertheless, stemming from work by the Prague Circle in the 1930s and �40s, there has been a long campaign to establish �universal alphabet� of features that are phonemic descriptors for all languages. The initial proposals defined acoustic features, in recognition of the predominantly social nature of language. This turned out to be problematic, and actually unworkable, and more recent formulations have included more and more features that are defined in physiological terms, harking back (largely without acknowledgement) to systems of features developed by Kenneth Pike in the 1940s and by Charles Hockett in the 1950s. [1] The motivation for this has been an anti-empiricist dogma that a child surely cannot learn language simply on the basis of exposure, and that language learning depends crucially upon innate structures �hard wired� in the human genome and in the human brain, which are then presumed to be the locus of these universal features. Here is not the place to address this issue�I have done so elsewhere. Suffice to say here that these neo-phrenologic teachings have not convinced me, and there is more than ample evidence to the contrary from e.g. statistical learning theory.
The relationship between acoustic and articulatory descriptors has to date not been resolved in linguistics. Further on I will return to this issue, and show how PCT can resolve it. We will also return to the question of identifying phonemic contrasts in a given language, which is really a question of identifying the variables that language users control in distinguishing different syllables and words from one another.
We will look at the acoustic side of things first. Speech sounds can be displayed as a sound spectrum, with time on the x axis and frequency on the y axis, from 0 to as high as about 8 KHz. The presence of acoustic energy at a particular frequency level is indicated by a darkening of the image. Local energy peaks in the spectrum appear as dark bands in the display. At about 0.4 sec in the display shown in 0 there are local peaks at about 700 Hz, 1100 Hz, and 2800 Hz. Long before the advent of sound spectrograph equipment in the 1940s these concentrations of energy in the sound wave were recognized by phoneticians, such as Alexander Graham Bell, and termed formants because of their constitutive role in speech sounds.
Figure 1. A wide-band spectrogram of the syllable [ba] (as in �bah bah black sheep�). Bands on the left margin are set by the spectrograph to help with visual estimation of frequencies. [L&B Fig. 5.2 p. 56] [2]
The lowest peak at about 140 Hz corresponds to the fundamental frequency of vibration of the vocal folds in the larynx, the �pitch� of the voice. The pitch varies somewhat even over this short time span. Since each vertical striation corresponds to one pulse of air pressure through the vocal folds, the average fundamental may be more directly measured by counting the number of vertical striations in the display over a given interval of time. There are about 14 in a 0.1 sec. Interval, hence the fundamental is estimated to be about 140 Hz.
What we saw in Figure 1. was a broad-band spectrogram. In a narrow-band spectrogram of the same syllable [ba] the individual harmonics of the fundamental are instead visible (Figure 2 ). These terms have their origin in the way that the spectrograms are made.
 0
0
The spectrogram is the output of a �stack� of filters, each of which lets a specified range of frequencies pass. In the original spectrograph devices a tape loop was played and with each repetition the filter range was moved up a notch. At the same time an electrode was moved upward on the surface of a drum rotating about a vertical axis. Specially prepared paper was fixed to the drum. Intensity of sound was transformed to intensity of an electrical spark, and the portion of paper through which the spark passed was darkened proportionally. If each filter lets a narrow band of frequencies pass, then each harmonic of the fundamental frequency is indicated by a separate striation from left to right when the paper is unwrapped from the drum�the wide-band spectrograph seen in 0 , where the individual harmonics become obscured because their energy is averaged over the entire band. When the filter bandwidth is reduced, the individual pulses of the fundamental frequency become visible (Figure 2).
The frequency ranges of the formants are independent of the �pitch� of the voice, that is, the fundamental frequency of the glottal pulse. One consequence is that the number of harmonics that fall within a formant is a function of pitch.
Recall that the vocal tract is a filter that lets certain harmonics through and damps other harmonics. For a deep voice, there are more harmonics within the band or �window� of a given formant, and for a high-pitched voice there may actually be no energy present in one or another of the formants because no harmonics of the higher fundamental frequency fall within that range. A readily accessible example is your ability to recognize vowels sung at a high pitch in a language that is unfamiliar to you (so that redundancies of speech cannot assist judgment).
Surprisingly, error rates in perception of speech sounds increases only very slightly as the frequency of phonation increases. It seems that in these circumstances, where there is no acoustic energy actually in the formant because it fails to coincide with any harmonic of the fundamental, we perceive a formant as a �window� that would let speech energy pass if there were any present. Perhaps the listener reconstructs the formant in relation to other vowels for which there is energy in the formant. This may also be a value of vibrato in the singing voice, moving harmonics up and down through the formants. Note, however, that a high soprano voice may actually be pitched higher than the first two formants. Thereby hangs an interesting, if somewhat tangential, experiment.
Experiment: Play a recording of a voice pronouncing various syllables with a fundamental frequency higher than 2500 Hz, and see if hearers can reliably recognize the vowels. (The E three octaves higher than the E above Middle C on the piano is at 2637.7 Hz.)
As a first investigation in this direction, Figure 4. shows a spectrogram of the vowel [i] produced at a pitch steadily rising from just under 400 Hz to almost 900 Hz.
The locations of formants for this speaker are shown in 0 . This tells us that the pitch of the production shown in 0 rises above the first formant for [i] less than halfway through, but never approaches the second formant. However, a pitch of 850�900 Hz. could easily rise above the second formant for other vowels, such as [a] and [u].
There may also be noise in the vocal signal apart from the glottal pulse of ordinary phonation. Thus, despite the high pitch of an infant�s voice, it is possible to identify formants because of its �breathy� quality.
If subjects can reliably recognize vowels where the fundamental frequency is higher than the formants, then they must be using acoustic information other than that which suffices for synthesizing speech. L&B suppose that �[h]uman listeners appear to derive formant frequencies through a procedure that makes use of their unconscious, internalized knowledge of the mechanisms of speech production� and note further:
It is possible to program digital computers to �recognize� vowels using this sort of procedure (Bell et al 1961). The computer program has access to a memory in which the acoustic consequences of various possible vocal tract shapes are stored. The computer systematically generates internal spectra using this memory. The internally generated spectra are then matched against the spectra of the incoming speech signal. The process does not select the individual formant frequencies on the basis of a single local energy maximum, but rather on the match between the total spectrum of the incoming speech signal and the internally generated signal specified by all three formant frequencies. (L&B p. 42).
The frequency ranges of the formants are not determined by the fundamental frequency or pitch of the voice, but they are at a higher frequency for women and children than they are for men, so that there is a rough correlation with pitch. The frequency ranges of the formants are determined by the length of the vocal tract. As the length of a tube changes, its resonant frequency changes, just as you get a lower or higher pitch by blowing across the necks of bottles of different size, or of bottles with different amounts of water in them to vary the length of the air column.
The locations of the formants within the range for the given vocal tract are determined by the relative lengths of two tubes, the smaller-diameter pharyngeal tube and the larger-diameter oral cavity. You lower the frequency of F2 by moving the narrowest constriction (made with the tongue) toward the back of the oral cavity, and also by protruding and rounding the lips as noted above, lengthening the larger tube Moving the closest constriction by the tongue forward in the mouth raises the frequency of F2. To increase the frequency of F1 you increase the cross-section of the oral cavity by lowering the tongue and jaw, and conversely by raising the tongue and jaw, thereby decreasing the cross-section of the oral cavity, you lower the frequency of F1.
There is interesting evidence in certain speech mannerisms that people control perceptions of their own voices by doing things that vary the length of the vocal tract. As many linguists and phoneticians have noted, young boys wishing to sound more manly often speak with lips protruded, as do women mimicking (perhaps disdainfully) the speech mannerisms of men. Protruding the lips lengthens the vocal tract, and therefore lowers the frequency ranges of the formants. You may also note that speaking with the lips spread minimizes the length of the vocal tract, producing a �smiling� voice quality that is generally perceived as non-threatening. (It seems to me that in both cases there are adjustments at the rear of the oral cavity made with the tongue, pharynx, and larynx that also affect the length of the vocal tract, but I know of no studies showing this.)
In every culture there are ritual phrases of greeting that are highly predictable and therefore practically empty of information. �Hi, how are you?� �Fine, and you?� One function of these customary greetings appears to be to enable each listener to attune to the formant range of the other speaker. Note, for example, that the [U] of hood in women�s speech is very close to the [u] of who�d in the speech of adolescents (and close to that of men on the other side).
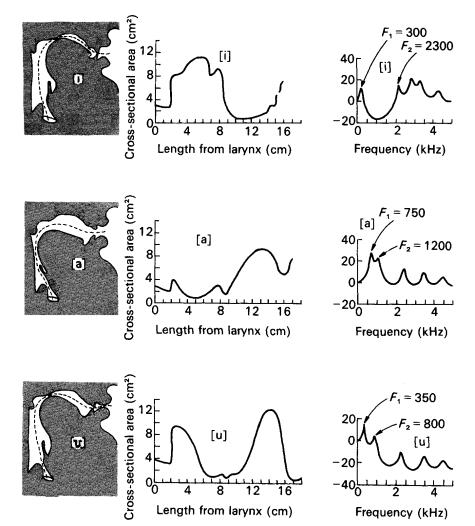
Figure 7. shows how configurations of the vocal apparatus, both in sagittal section and in a plot of cross-sectional area at various distances from the larynx, correlate with the formants. (Formants above F2 are shown in the graphs of transfer functions, but are not labeled.)
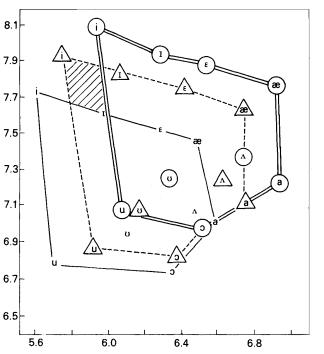
The length of the vocal tract and the limits of movement of these articulators thus determine what may be called the �vowel space� for a given speaker. By plotting F1 on the x axis and F2 on the y axis we can identify locations of vowels in a �map� that correlates with the locations of the narrowest constriction by the tongue in the oral cavity. The conventional diagram used by the International Phonetic Association and others is shown in 0 .
0 ).
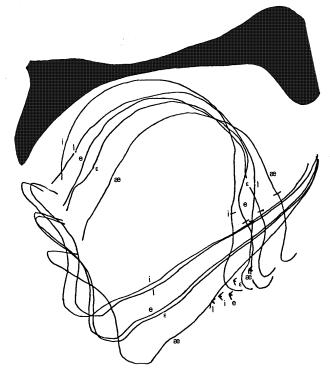
Figure 9. Radiographic data derived from an X-ray movie of a speaker producing the English front vowels [i], [I], [e], [E]. The tongue contours were sketched from motion picture frames that were exposed during the most stable part of each vowel�s articulation. The contour of the mandible is also sketched. [L&B Fig. 8.4 p. 168]
Figure 10. X-ray tracings for another speaker. Note pairwise swapping of vowels from expected positions.
Figure 11. X-ray tracings for a third speaker.While the jaw positions are as expected (albeit with the two highest vowels virtually indistinguishable), tongue configurations are quite inconsistent with perceived vowel height.
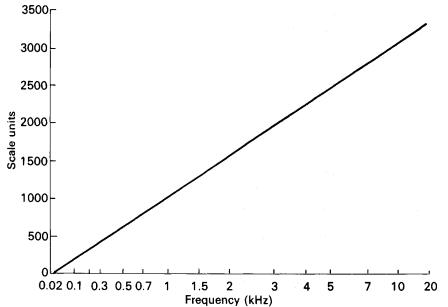
A frequency of 1000 Hz (1 KHz) is a pitch of 1000 Mel, but 500 Mel is 400 Hz, and 2000 Mel is about 3100 Hz.
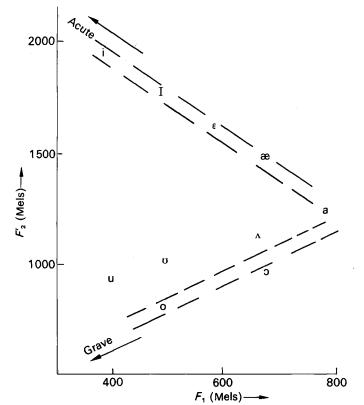
Figure 13. Acoustic classification of the vowels of American English in terms of Mel values of first formant and �equivalent� second formant frequencies. [L&B Fig. 8.11 p. 182]
Note how the vowels are distributed fairly evenly along the periphery of the vowel triangle. (Acute and grave are acoustically defined features that have been used to differentiate two classes of �peripheral� vowels.)
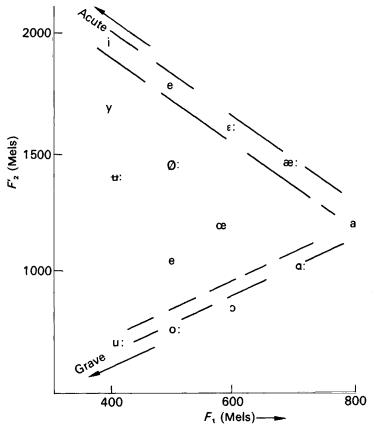
The three apex vowels [i], [a], and [u] are easiest for hearers to recognize (fewest errors by a factor of 10). Most languages have other vowels in addition to these three, but universally every language includes these three vowels. They are maximally distant from one another in the �vowel space� for a given vocal tract. Further, additional vowels in any given language are spaced more or less maximally from one another and from the apex vowels; exceptions, such as the [�] vs. [O] in the Swedish vowel space, or the [�] vs. [�] in the American English vowel space, are typically unstable, subject to dialect variation and in process of change. This maximization of separation in the vowel space has the effect of controlling phonemic contrast.
The correlation of formant coordinates with positions on the vowel triangle is very pretty, as far as it goes. There is, unfortunately, a problem on the articulatory side. Speakers do not all control vowels in a way that so nicely conforms to the vowel triangle as that shown in 0 . For some speakers, tongue contours recorded in this way are little differentiated, or even change the sequence from to [i], [I], [e], [E] to [i], [e], [I], [E] (L&B Figures 8.2 and 8.3).
The perception of the relationships among vowels as being higher, lower, etc. may be fundamentally an acoustic perception. However, this does not prove that vowel production is the control of auditory perceptions alone. We will return to this point.
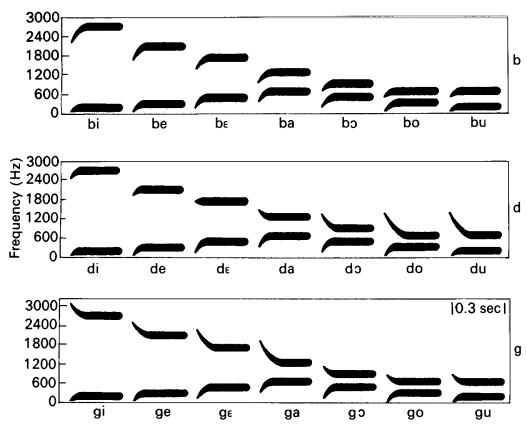
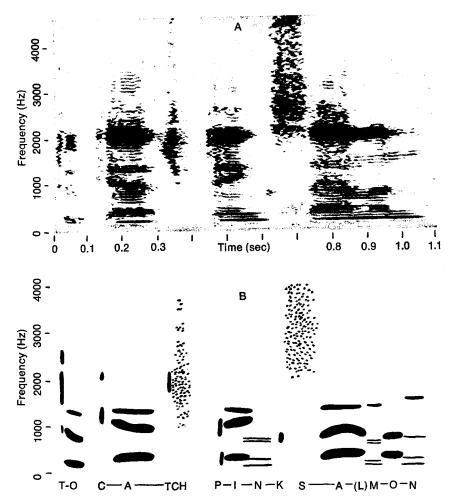
The perceptible indications of a consonant usually include an interruption (or in some cases attenuation) of the glottal vibration, and they can involve aperiodic noise of sounds like the [s] of salmon in 0 , but these very short transitions in the formants are what in almost all cases distinguish consonants from one another.
The formant frequencies can vary continuously, but there are some conditions which favor a more discrete differentiation, such that a certain amount of imprecision in articulation makes little or no difference for recognition. Sounds produced in these regions are termed �quantal� sounds. [3]
The acoustic signature of a consonant is a relatively rapid transition of formants (0 ), in most cases an interruption or attenuation of the energy in the acoustic signal, and in many cases the characteristic aperiodic noise accompanying the release of closure or the turbulence of near-closure for a fricative or sibilant sound. On the face of it, you would expect a continuous gradation of different consonants corresponding to the infinite differentiation of places at which the tongue and lips can locate the narrowest constriction in the oral cavity. However, the claim is made that the languages of the world use at most seven different places of articulation, although no language uses all seven. Stevens (1972) identified �quantal� regions within which small articulatory differences make no acoustic difference. (Ladefoged and Maddieson [4] prefer the term �modal�.) At the boundaries of these regions, however, a small shift makes a large change from the acoustic pattern that is characteristic of one quantal region to the acoustic pattern that is characteristic of the adjacent quantal region. Each of these acoustic patterns is characterized by well-defined peaks in the acoustic spectrum. These physiological and acoustic effects provide �affordances� for pronouncing consonants.
Stevens� theory of the �quantal� properties of speech also refers to the �apex� vowels [i], [a], and [u] as �quantal� vowels. For example, for [a], the cross-sectional area of the oral cavity is about 10 times that of the pharyngeal tract, and the transition of pressure waves from the latter to the former is at about the midpoint of the vocal tract. If the transition point is moved a centimeter or so forward of center, then F1 is generated in the pharyngeal tube and F2 in the slightly shorter oral cavity; if the transition point is moved a centimeter or so back of center, then the sources of F1 and F2 are reversed, but it makes no difference to the acoustic waveform, F1 and F2 are still very close to one another at the same frequencies (Lieberman 173�174). Thus, a considerable lack of precision in articulation makes little or no acoustic difference.
There are other factors favoring the vowels at the apex of the vowel triangle. For the vowel [i], F2 is at its high extreme, near F3, so that the two formants together constitute a peak of energy in the acoustic spectrum; for the vowel [a] F1 is at its high extreme and F2 converges relatively low next to it, forming a spectral peak in the low-mid range; and for the vowel [u] F1 and F2 are both low. Perhaps more importantly, kinesthetic and tactile perceptions are more salient at the apices of the �vowel triangle�: you cannot open your mouth wider than for [a], nor thrust your tongue up and forward farther than for [i], nor up and back farther than for [u] without producing air turbulence and the sound of a fricative consonant instead of a vowel. With the vowel [u] there is also a limit to how closely the lips may be approximated without producing a bilabial fricative [B].
As may be seen in 0 , for the vowels [o] and [�] the first two formants are also close together. However, with this pair of vowels, relatively slight changes in configuration of the vocal tract affect the acoustic signal and the perceived vowel.
In addition to place of articulation there are other variables which speakers of one language or another control to distinguish different utterances from one another. The most common of these are:
Other combinations with laryngeal activity are fairly common: Sounds that are usually voiced may be devoiced, whispered, accompanied by �creaky voice� (�laryngealization�) or outright closure of the larynx (�glotallization�). Other articulatory combinations occur: For laterals like English [l] the oral cavity is closed by the tip of the tongue but open at the sides of the tongue. Labiovelars like [kw] combine occlusion at both the front and back of the oral cavity. An excellent survey, including exceptionally clear sound spectrograms, may be found in Chapter 10, �Multiple articulatory gestures�, in Ladefoged & Maddieson (op. cit.).
It can be readily seen that the combination of variables such as voicing and nasalization with place of articulation afford a natural cross-classification of speech sounds, e.g.
p t k
b d g
m n
In this array, all the consonants in a column have their oral occlusion at the same place, and all the consonants in a given row are alike with respect to voicing and nasality. The consonants of every language fall into an array of this sort. There is what is called a �universal tendency� to have no gaps in the array, that is, consonant systems universally tend to be symmetrical. This is often taken as prima facie evidence that what people are controlling are not the sound segments (as represented by letters) but the features that the segments in a given row or column have in common.
By extensive computer modeling and simulation, researchers at Haskins Laboratories at Yale have developed a �gestural� approach, [5] exemplified in 0 for the word �pawn�. 0 shows a �gestural score�, a graph of aperture changes for each of five �articulator sets�, the velum, tongue tip, tongue body, lips, and glottis. In a �gestural score�, each line represents states of an articulator, and the vertical alignment of transitions from one state to another represents the coordination and relative timing of gestures by the several articulators. (Note that a higher position on the y axis generally signifies a more closed aperture for all articulators, except that for the glottis the sense is reversed.)
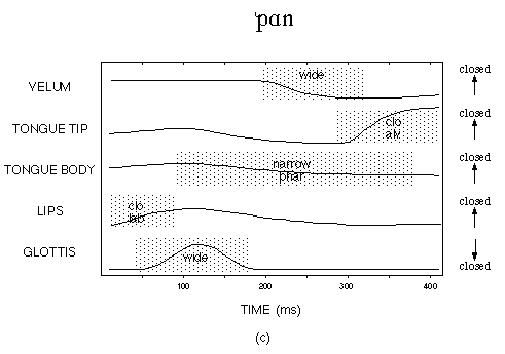
Figure 16. A representation of a �gestural score� for the word pawn [http://www.haskins.yale.edu/haskins/MISC/RESEARCH/GesturalModel.html]
The labels abbreviate numeric specifications in a �gesture dictionary�. For example, in the label {clo alv} for the tongue tip, �{clo} stands for -3.5 mm (negative value indicates compression of the surfaces), and {alv} stands for 56 degrees (where 90 degrees is vertical and would correspond to a midpalatal constriction)� (op. cit.).
Timing of gestures relative to one another is critical. �For example, the tongue tip {clo alv} gesture and the velum {wide} gesture (for nasalization) are phased such that the point indicating 0 degrees�onset of movement�of the tongue tip closure gesture is synchronized with the point indicating 240 degrees�achievement of goal�of the velic gesture.� A side effect of this particular overlap of gestures is the nasalization of the latter portion of the vowel, which is not distinctive in English.
While the Haskins �gestural score� has proved an efficient and informative representation for analysis and synthesis of speech, it does not identify variables that the speaker and listener can perceive, only variables that the phonetician can perceive by means of X-ray photography and so on. The speaker and listener surely do not perceive millimeters of aperture, any more than an airplane pilot perceives the angles of control surfaces. And of course the parameters measured for the gestural score do not correlate with myographic and other measures of muscle effort, which reflect the influence of disturbances: e.g. if the speaker is lying down or hanging upside down efforts change considerably to resist the effect of gravity on the articulators, while achieving the same apertures with them.
Acoustic features may be expected to correlate well with what the listener hears, and with the speaker�s perception of the sounds of her own speech. For this, the Mel scale is evidently more relevant than straightforward frequency measurement. However, listeners cannot see inside the vocal tracts of speakers or of themselves. To be relevant, articulatory descriptors must be mapped to corresponding kinesthetic and tactile perceptions. The relationship between control of auditory perceptions of the sounds of one�s own speaking and control of kinesthetic and tactile perceptions in the oral cavity helps to explain why this has been such a vexed issue.
The relationship between acoustic and articulatory descriptors has to date not been resolved in linguistics. I believe that PCT can resolve this issue.
There is obvious evidence that people control auditory perceptions in speaking. If they notice that they have mispronounced a word, they say it again, usually with exaggerated precision. Evidence for control of tactile and kinesthetic perceptions is less obvious.
In an experiment I recorded myself reading a text with auditory feedback masked. If solely auditory perceptions were controlled, one would expect the accuracy of articulation to break down, much as accuracy in placing objects would deteriorate in the absence of light. That my pronunciation did not change over the course of reading a long text demonstrates that perceptions other than auditory perceptions are being controlled.
Philip Hoole, [6] working with a patient who had no sensation in the oral cavity, strongly disturbed articulatory control (with a bite block), overwhelmed auditory control (with 30 dB white noise), and both together. He found that �in the absence of oral afferent information articulatory compensation was forced to rely on auditory feedback� with consequent delay in �compensating for� the bite block. The assumption is that control of speaking depends upon neural signals from the oral cavity, as well as auditory input. This appears to demonstrate that acoustic input can be used to re-set reference values for whatever non-acoustic input is being controlled, and it is this which accounts for the delay in �compensating� for the bite block.
It appears to me that tactile and perhaps kinesthetic (e.g. tongue and lip configuration) perceptions are controlled as means of controlling speaking. The reference values for these perceptions for a given phoneme (or perhaps for a given syllable) are set by control of auditory perceptions. Vowel articulation affords less tactile feedback than consonants do, because there is less contact of articulators. In Hoole�s experiments, vowels were more disturbed than consonants, of the vowels u was more disturbed than a and i, and of the consonants s was more disturbed than consonants like t and l. These results suggest that of the non-auditory perceptions of speech, tactile perception is easiest to control, followed by perception of the configurations of the tongue, lips, and jaw. A prediction follows that could be tested, that susceptibility to disturbance is proportional to the degree of aperture in the articulation of speech sounds. Anecdotally, I can say that sibilants s, S (�sh�) are difficult to control when the tongue tip is numbed with novocaine, and p, b, f, v are somewhat difficult to control (and �feel� awkward) when the lips are numbed.
In addition to vowels and consonants there are �suprasegmental� phonemes of pitch, accent, intonation contour, and the like. These are not merely expressive intonations, but formal requirements for the given language. Like the segmental phonemes, they are learned by the members of a speech community as arbitrary and discrete elements.
To test for controlled variables we require gentle disturbances that can be controlled and measured by an observer. The oral cavity and speech organs are rather well protected from such disturbances.� �Coarticulation effects��where control actions for adjacent phonemes interfere with one another�are indeed disturbances, but they are not controlled by the observer and can be measured only with respect to �ideal� control actions for the �same phonemes� without such interference (because of the mutual disturbance). If the complexity of the problem is not immediately apparent, then as a starting point consider (in 0 ) the diversity of the formant transients for the �same� consonant, depending on the adjacent vowel.
Ladefoged observed that muscle efforts must vary to produce the same articulatory and acoustic result when the speaker is hanging upside down. (This obviously also applies to any change of orientation and to inertial forces under acceleration.) However, to my knowledge there have been no studies calculating the effect of gravity on the tongue, jaw, and other articulators.
On the other hand there is a substantial literature involving disturbances that overwhelm control in one or another aspect.
Many studies, such as that of Hoole cited earlier, have been done with a dentist�s bite block preventing closure of the jaw past a certain point. This changes the position from which the muscles of the tongue act during speaking. Ordinarily, jaw height changes together with tongue height. If control of jaw height is overwhelmed with a bite block, then tongue height can be controlled with the muscles of the tongue alone. There are a dozen or so muscles in and connecting into the tongue (Gray�s Anatomy 323�327). Hoole also reported masking auditory perception with white noise.
As a kind of exotic extreme, Madelaine Plauch� and John Ohala at UC Berkeley investigated the effect of cosmetic body piercing of the lips, tongue, and cheeks. They interviewed �piercees� and the professionals (piercers and physicians) who treat them. Acoustic and impressionistic auditory analyses were made of the speech of a subset of �piercees� and discussed the results in a series of case studies. �Piercings may affect the ability of speakers to make certain articulatory gestures and may alter normal speech aerodynamics but in most cases, speakers find alternative production strategies to make speech sound right, suggesting that speakers aim not only at an articulatory target, but also an acoustic one.� [7] For example, one woman had progressively enlarged a hole in her cheek (held open by an �eyelet�), and when the aperture reached 6mm she found that the loss of air pressure interfered with consonants like p. Her �alternative strategy� was a �tongue-in-cheek� maneuver to block the opening with the side of her tongue while producing those consonants. This may have interfered with pronunciation of nearby sounds, as e.g. the t in pat, but the article makes no comment on this.
The Motor Theory of Speech Perception [8] says that what is common to the perception and production of speech is �the intended phonetic gesture of the speaker, represented in the brain as invariant motor commands that call for movements of the articulators� (Liberman and Mattingly, 1985, p.2). In the elaboration of this theory, speech perception is inherently distinct and independent from general-purpose auditory perception. A special phonetic system processes auditory input first, and the general auditory system subsequently processes the residue in the acoustic signal. The phonetic processor can affect the functioning of the general auditory system (by either removing information from the signal or leaving it in), but not vice versa. Chris Darwin has done some work on the perception of a tone as either integrated with a vowel formant (making a change in the perceived quality of the vowel), or as a sound external to speech. [9]
It is not difficult to see how to reframe this in terms of a pandaemonium of control systems. In a typically noisy environment, a given sound might be recognized, for example, as the noise component of s and at the same time be recognized by another control system as the hiss of a drop of water on a hot surface. Each of the two systems sends upward a signal whose import is that the given sound has been recognized, though in one an s has been recognized and in the other a hiss. Which of them �wins� depends upon which of these signals is successfully controlled by other systems. What this amounts to subjectively is fitting the perception consistently into the context of someone speaking, or into the context of water dripping onto the hotplate. [10]
There is some discussion of feedback in speech production. John Houde, whose name came up on CSGnet in connection with real-time disturbance of the speech signal, has funding from the James S. McDonnell Foundation to investigate �the role of auditory feedback in speech production. [11]
MacNeilage, P. (1979) Feedback in speech production: current issues. Paper read to the International Symposium on the Cognitive Representation of Speech, Edinburgh, July 29 to August 1st �79
Phonemic and
Postural Effects on the Production of Prosody
www.lpl.univ-aix.fr/projects/aix02/ sp2002/pdf/moebius-dogil.pdf
Perkell, J. (1979) Feedback in the control of speech production. Paper read to the International Symposium on the Cognitive Representation of Speech, Edinburgh, July 29 to August 1st �79
Perkell, J.S.; Guenther, F.H.; Lane, H.; Matthies, M.L.; Perrier, P.; Vick, J.; Wilhelms-Tricarico, R.; Zandipour, M. 2000. �A theory of speech motor control and supporting data from speakers with normal hearing and with pro-found hearing loss.� Journal of Phonetics, 28(3), 233�272.
BITE-BLOCK SPEECH IN THE ABSENCE OF ORAL SENSIBILITY PHILIP HOOLE
Proc. 11 th Int.
Cong. Phonetic Sciences Tallinn, 1987, Volume 4, 16:19 Paper Se 57.1
www.phonetik.uni-muenchen.de/~hoole/pdf/bb_tallinn.pdf
�[PS]www.cstr.ed.ac.uk/publications/papers/2001/Richmond_2001_a.ps
[PS]www.cstr.ed.ac.uk/publications/papers/1999/Richmond_1999_a.ps
[PDF]MIXTURE
DENSITY NETWORKS, HUMAN ARTICULATORY DATA AND ACOUSTIC- ...
�archive.ling.ed.ac.uk/documents/disk0/ 00/00/01/52/taal00000152-01/paper.pdf
[PDF]The
Control of Token-to-Token Variability: an Experimental and ...
�www.zas.gwz-berlin.de/mitarb/homepage/ fuchs/mooshammer_et_al.pdf
Measuring
and Analyzing: a paradigm for speech research
www.haskins.yale.edu/haskins/HEADS/MMSP/measurec.html
[PDF]REDICTING
PALATAL CONTACTS FROM JAW AND TONGUE COMMANDS A NEW ...
�www.icp.inpg.fr/OHLL/lesPubliRapports/SPS5-palato.pdf - Similar
pages
Institute
of Phonetic Sciences,
fonsg3.let.uva.nl/Proceedings/Proceedings24/
Proc24Pols_corrton.html - 33k - Cached
- Similar
pages
http://www.google.com/search?q=%22bite+block%22+phonetic&sourceid=mozilla-search&start=0&start=0
Mark Tatham, Model Building in Phonetic Theory
http://www.essex.ac.uk/speech/archive/building/building.html
Robert F. Port, Is There a Universal Phonetic Space?:� Why Apriori Phonetic
Transcription is Not Possible
http://www.cs.indiana.edu/~port/teach/541/against.transcription.new.html
Louis C.W. Pols, Acquiring and implementing phonetic knowledge
http://fonsg3.let.uva.nl/Proceedings/Proceedings24/LouisPols24.pdf
We are so accustomed to our alphabetic writing systems that a segmentation of speech into letter-like phonemes seems both obvious and necessary. Examination of a gestural score like that in 0 calls this into question. There are cases where two vowels are acoustically indiscriminable but consistently different in articulation (e.g. lip rounding [12] or advancement/retraction of the tongue root [13] ). The given articulatory feature extends over all the vowels of a specifiable domain, typically per word, in what is called vowel harmony, and so native speakers are never in doubt which vowel to articulate or which they are hearing. See
There is various indirect and naturalistic evidence for controlled variables. Two examples are language change through time, and perception of one language by speakers of another.
A classic example of identifying controlled variables from the evidence of cross-linguistic confusions is The Pronunciation of Greek and Latin: The Sounds and Accents by William H. Sturtevant. One source of evidence was misspellings of Greek and Latin words in inscriptions made by foreigners. More recent research was surveyed by Winifred Strange in 1995. [14]
The literature of language change and linguistic reconstruction is too vast to summarize here. Historical and comparative linguistics is one of the great, if currently unsung, achievements of 19th century science. By way of illustration of the efficacy of its methods, suffice to say that words have been reconstructed in Latin which were not attested in any records, but which were later found written in inscriptions discovered by archaeologists.
The pandaemonium process referred to earlier obviously is not limited to placing a given perceptual signal into a phonetic or phonemic context. It is easy to confirm that we perceive the intended word even when part or all of it is missing from the input, reconstructing it on the basis of syntactic, semantic, stylistic, and other dependencies.
[This is an incomplete draft, alas. [15] ]�
[1] Hockett, Charles F. (1955) A Manual of Phonology, Baltimore: Waverly Press. Pike, Kenneth L. 1943. Phonetics: a critical analysis of phonetic theory and a technic for the practical description of sounds. University of Michigan publications. Language and Literature, 21. Ann Arbor: University of Michigan.
[2] The abbreviation L&B refers to Lieberman, Philip & Sheila Blumstein, Speech physiology, speech perception, and acoustic phonetics, Cambridge Studies in Speech Science & Communication, CUP 1988.
[3] Stevens, Kenneth N. (1972) �Quantal nature of speech�, in E. E. David Jr. and P. B. Denes (eds.), Humand communication: A unified view.
[4] Ladefoged, Peter, & Ian Maddieson, The sounds of the world�s languages, Blackwell, 1996
[5] See the overview at http://www.haskins.yale.edu/haskins/MISC/RESEARCH/GesturalModel.html and the references, especially those by Browman and Goldstein.
[6] �Bite-block speech in the absence of oral sensibility�, Proc. 11th International Congress of Phonetic Sciences Tallinn, 1987, Volume 4, 16:19 Paper Se 57.1 www.phonetik.uni-muenchen.de/~hoole/pdf/bb_tallinn.pdf. Hoole is at the Institut f�r Phonetik und Sprachliche Kommunikation, Ludwig-Maximilians-Universit�t M�nchen, Germany.� In other research (reported in notes for an oral presentation, �Tongue-jaw trade-offs and naturally occuring perturbation� www.phonetik.uni-muenchen.de/~hoole/pdf/dfgsp_fol1.pdf), Hoole placed sensors at various places on the tongue and elsewhere in the oral cavity and plotted their positions for loud and normal speech with various consonants between pairs of vowels i, a, u. Loud speaking has an effect similar to a bite block, due to wider opening of the jaw to allow greater volume of sound to emerge, but is not controlled or so easily measured by the observer. This document is of particular interest because it presents data for individual speakers, albeit not detailed numeric data.
[7] Madelaine Plauch� & John Ohala, Phonetic consequences of body piercing of the speech organs� http://ist-socrates.berkeley.edu/~mcp/Piercing.pdf, emphasis in original.
[8] Liberman, A. M., & Mattingly, I. G. (1985). The motor theory of speech perception revised. Cognition, 21, 1-36.
[9] Darwin, C. J. 1984. �Perceiving vowels in the presence of another sound: Constraints on dormant perception.� Journal of the Acoustical Society of America, 76, 1636-1647.
[10] Of course the same sound might be recognized as another speech sound (f or even the release of an oral stop like t) or another environmental sound. Several relevant studies are at http://www.sonicpuzzle.com/Shafiro_CV.html.)
[11] An abstract is at http://www.jsmf.org/old_site/programs/mcpewprograms/CNS%20WEB%20ABS/98%20cns%20abs/98%20Houde.htm
[12] Fred Householder, �Vowel overlap in Azerbaijani� in A. Valdman (ed.) Papers � in the memory of Pierre Delattre (Moutin, 1972).
[13] Leon Jakobson, Vowel harmony in Dholuo, unpublished PhD dissertation, UCLA Dept. of Linguistics 1978.
[14] Strange, Winifred. 1995. "Phonetics of second language acquisition: past, present and future", in Elenius, K. & P. Branderud, (Eds.) Proceedings of the XIIIth International Congress of Phonetic Sciences. Stockholm, Sweden, 13-19 August, 1995. Stockholm: KTH / Stockholm University. Vol. 4. pp. 84-91.
Strange, Winifred. (1995). Cross-language studies of speech perception: A historical review. In Strange, W. (ed.) Speech perception and linguistic experience: Theoretical and methodological issues in cross-language speech research. Timonium, MD: York Press (pp. 3‑45).
[15] Progress from here to Markov-chain dependency of phoneme-successors for sentence, word, and morpheme boundaries, statistical learning for morpheme classes and sentence forms, dependence on dependence for operator grammar and linguistic information, sublanguage for informational precision in closely specified domains. Missing too, still, is a discussion of conventionalization among participants in a public, underwriting all of this.